
The nomograph doesn't just illustrate the answer. It draws it live.
RigidIQ is built around a genuinely dynamic AASHTO nomograph tracer: change a traffic, subgrade, or slab input and the tracer redraws its path across the actual published chart in real time — not a static picture with a box around a number.
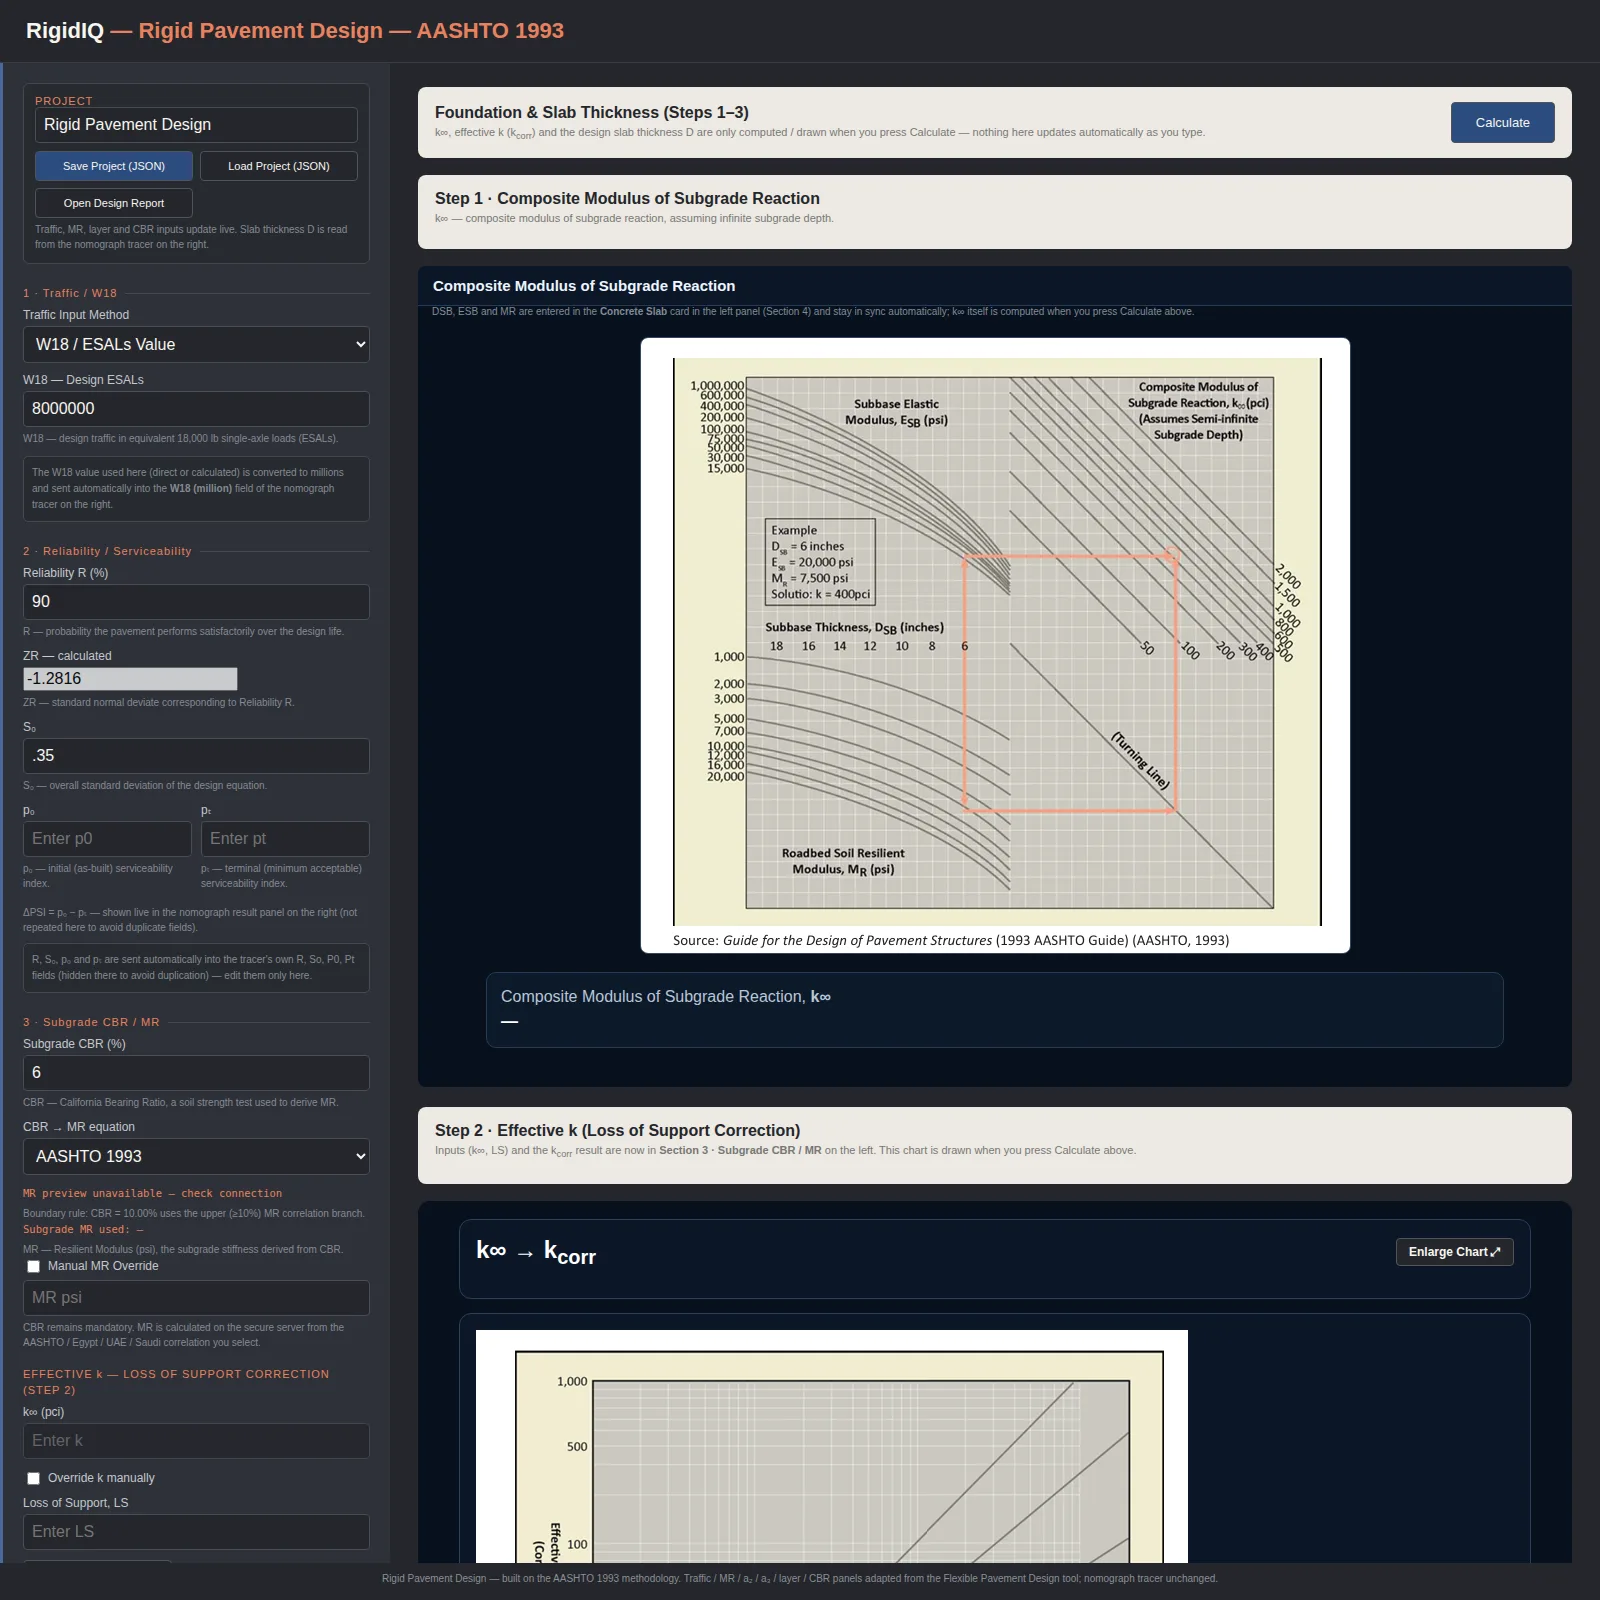
Three numbered steps, each one traceable back to a chart.
RigidIQ doesn't hide the AASHTO nomographs behind a calculated result — it draws your specific project's path across them, so a reviewer can follow the design the same way they'd check it by hand.
Composite modulus of subgrade reaction, k∞
Subbase thickness, subbase elastic modulus, and subgrade resilient modulus are traced live across the published AASHTO chart, with a highlighted box showing exactly where the project's numbers land.
Effective k — loss-of-support correction
k∞ and the loss-of-support factor LS feed a second, independently enlargeable chart that corrects for potential erosion or voiding beneath the slab.
Design slab thickness
Traffic, reliability, and the corrected k-value are combined to solve the AASHTO 1993 rigid pavement equation for the required slab thickness D.
Everything updates as you type
Traffic, MR, layer and CBR inputs update live; slab thickness is read directly off the nomograph tracer, and a "Live Calculated Layer Properties" panel keeps every intermediate value in view.
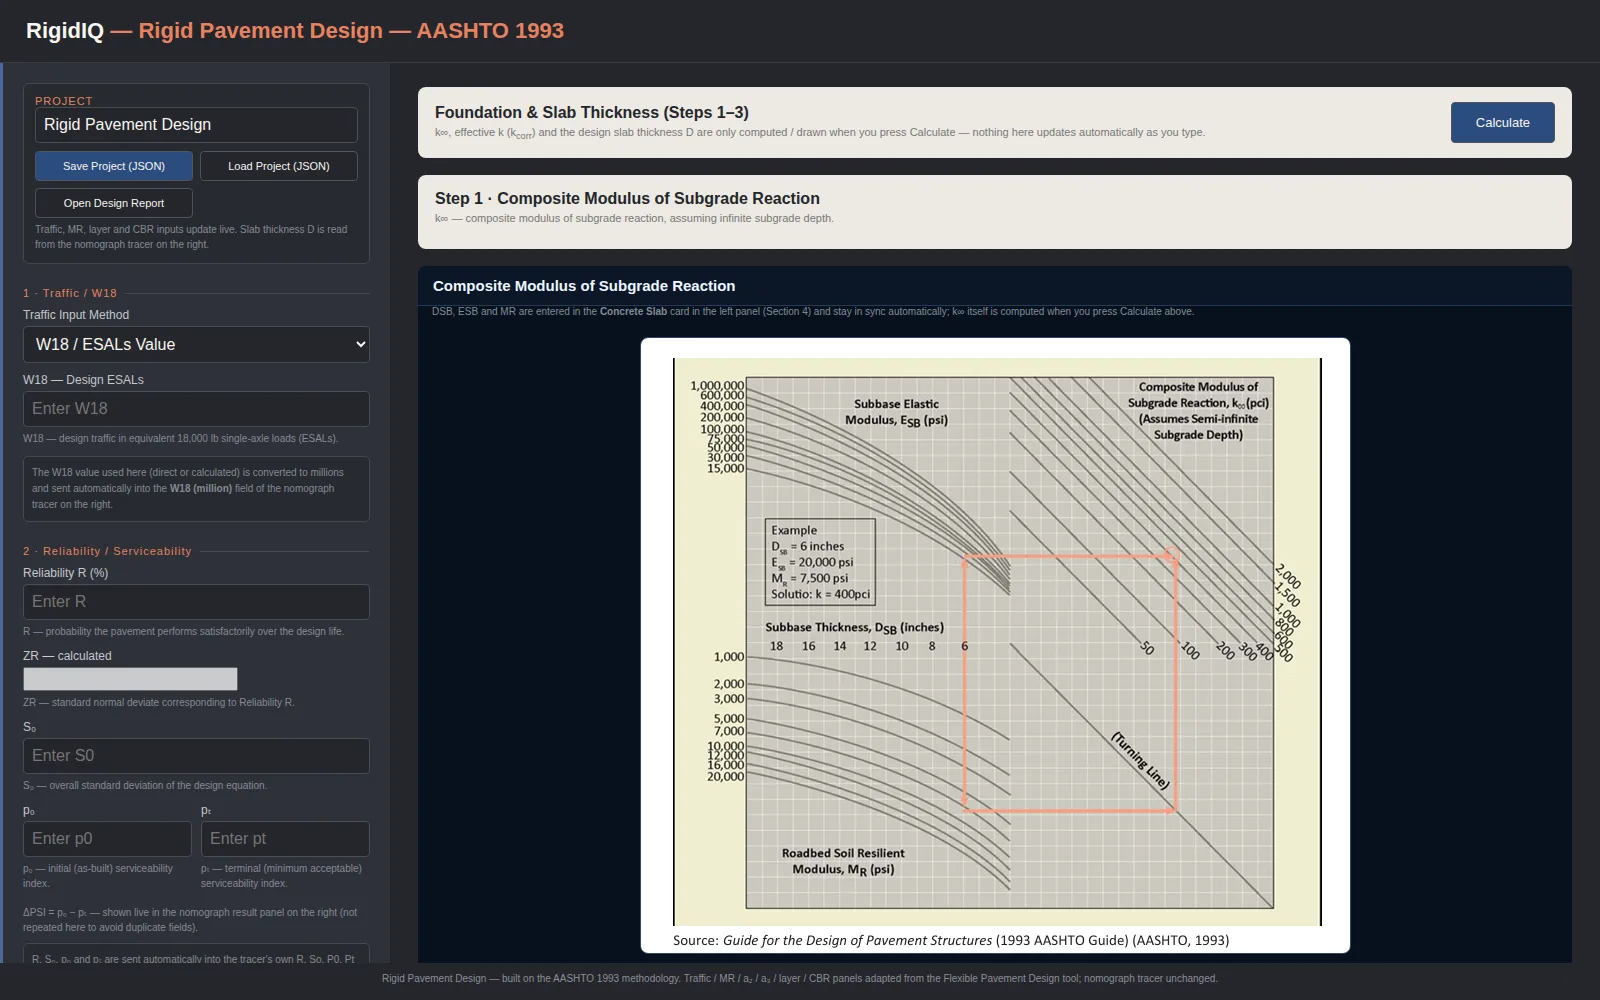
The same chart from the AASHTO Guide for the Design of Pavement Structures.
RigidIQ reproduces the published nomograph exactly — subbase elastic modulus on one axis, roadbed soil resilient modulus on the other, a turning line in the middle — then draws the project's own path across it as inputs change.
- Composite k, MR, layer, and CBR panels stay in sync with the traffic and reliability inputs on the left
- Both charts open in an enlarged view for a closer read or for a report
- Traffic, MR, a₂/a₃ layer, and CBR panels are adapted from the FlexiQ tool, so the two calculators share the same underlying logic
See the tracer respond to real project numbers.
Bring a real k-value or traffic count and watch the tracer move.
Request a demonstration to see the nomograph respond to your project's own numbers.